

DVIA v2 iOS Anti-Debugging Bypass with LLDB
This is my solution to bypass anti-debugging checks on Damn Vulnerable iOS Application v2. While reversing the application, I noticed the presence of two anti-debugging checks, but only one was activated, because of this, after bypass the first anti-debugging, I decided to activate the second anti-debugging method at the application start up as follow.
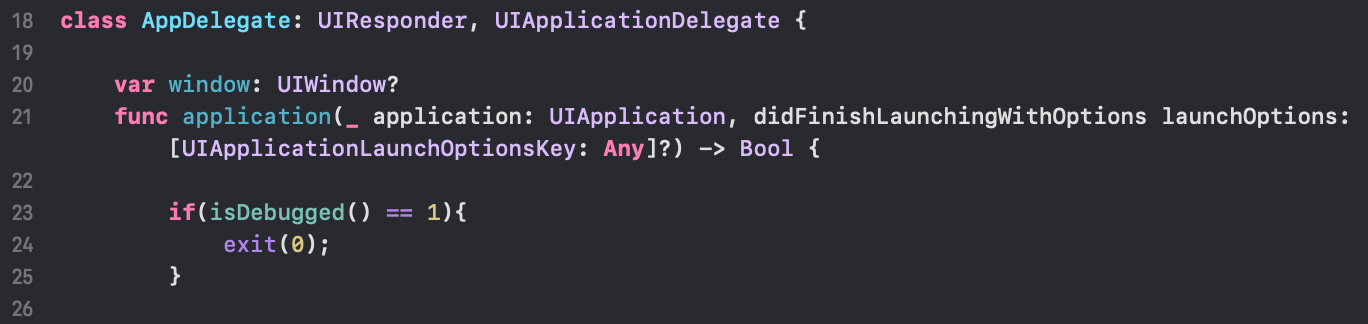
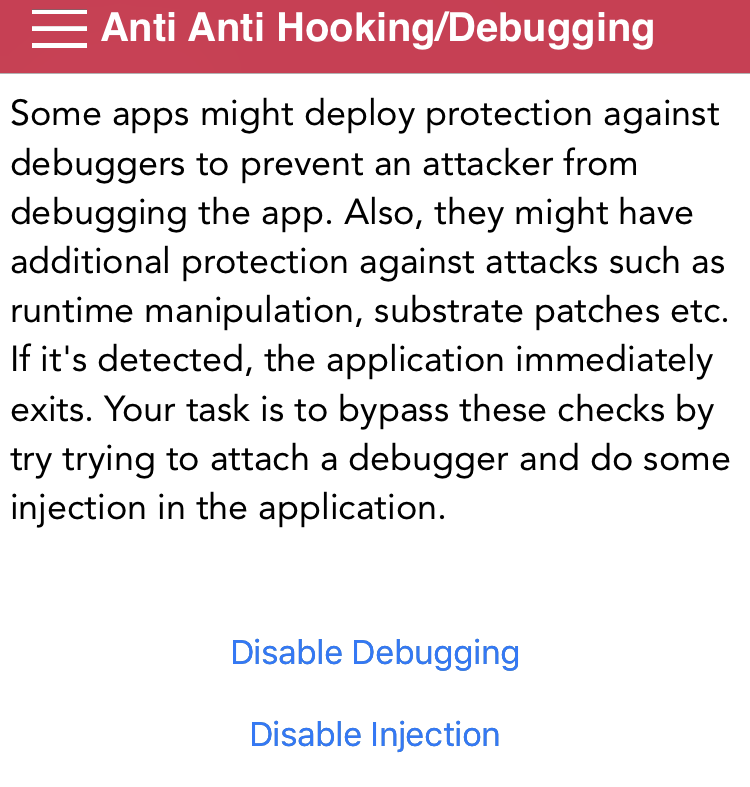
So, in my DVIA v2 there are two anti-debugging checks first one at the start of the application and the second one enabled when pressing the “Disable debugging” button in the “Anti Hooking/Debugging” section.
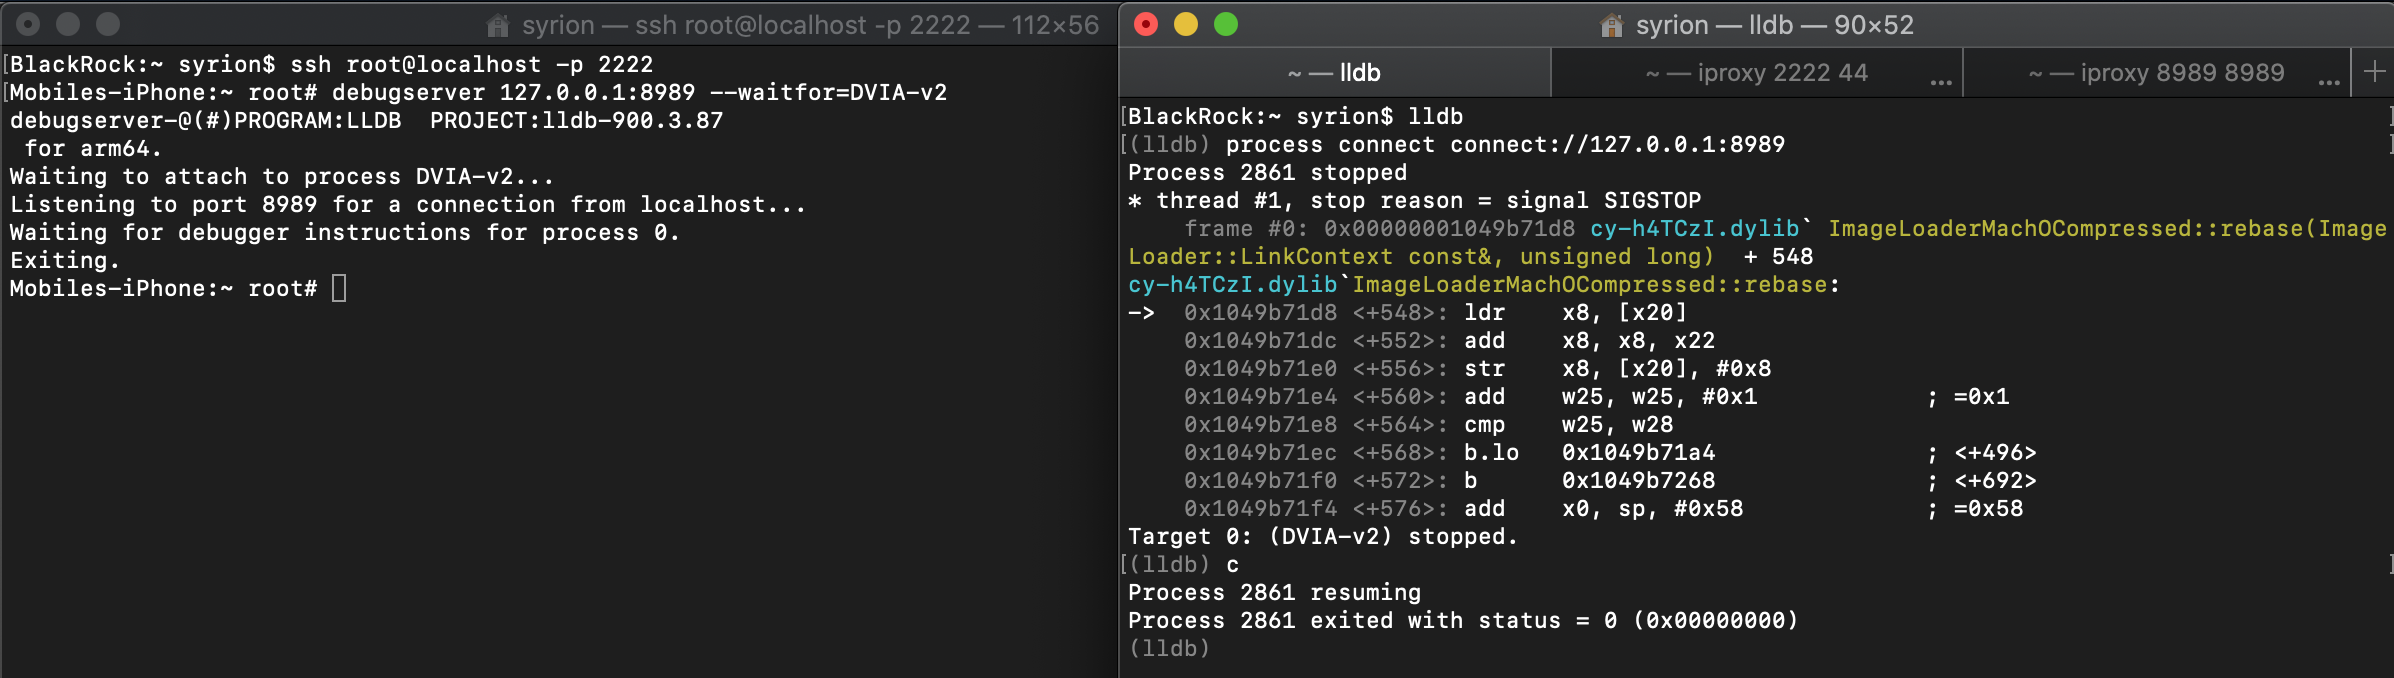
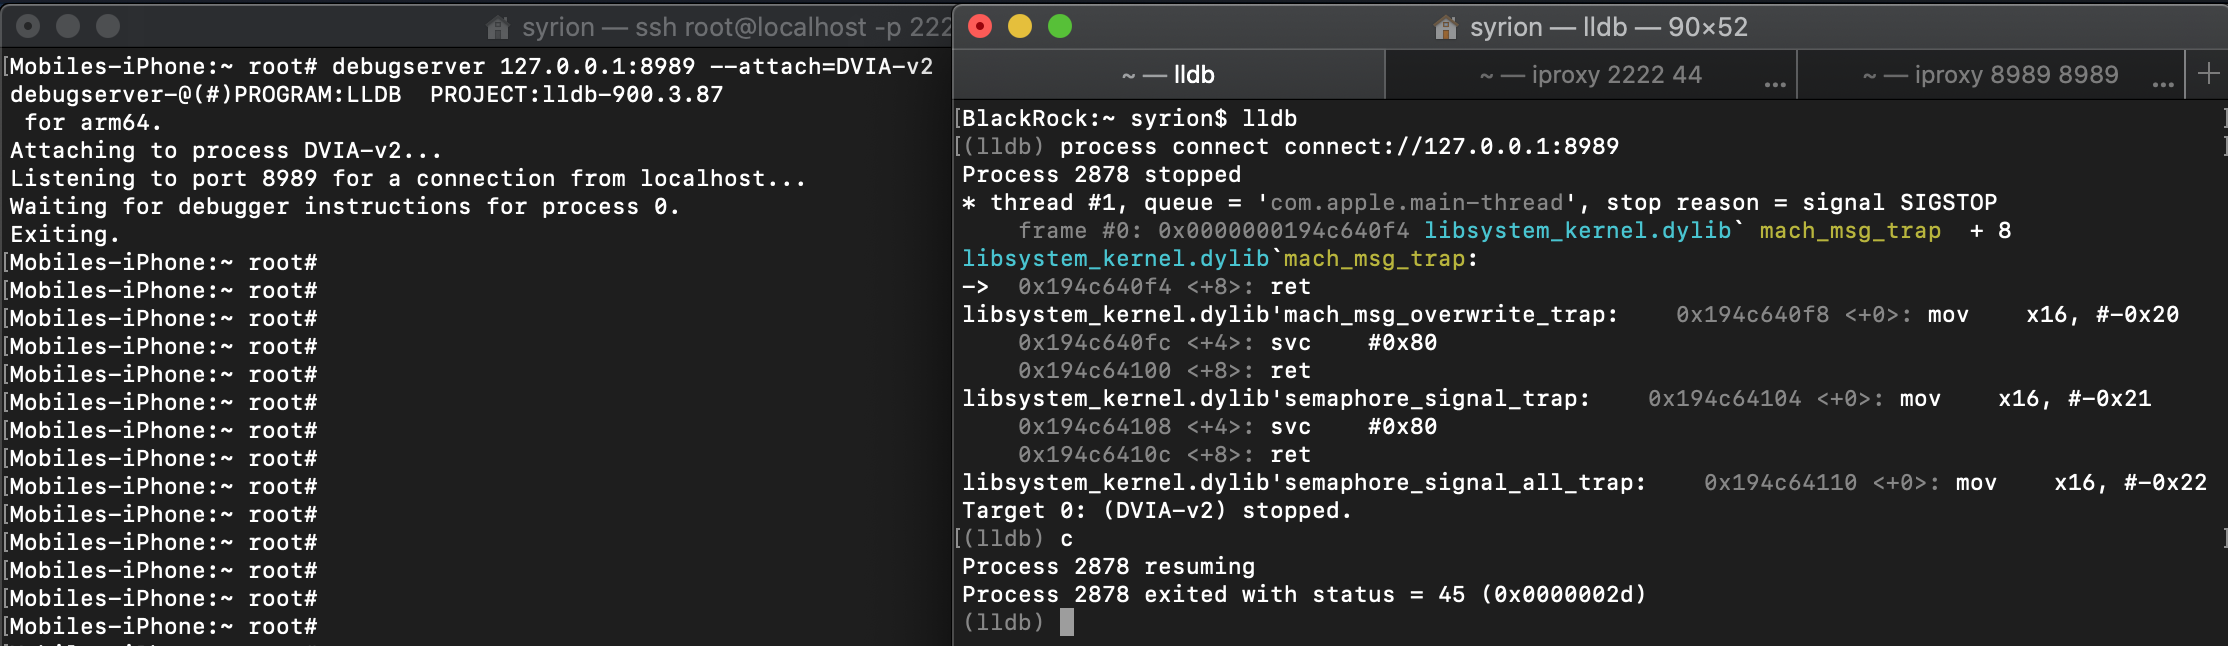
If we try to debug DVIA v2, it will exit with status 0 when we continue the execution in the debugger.
If we enable the anti-debugging check though the button “Disable debugging”, the debugger will not be able to attach the application process.
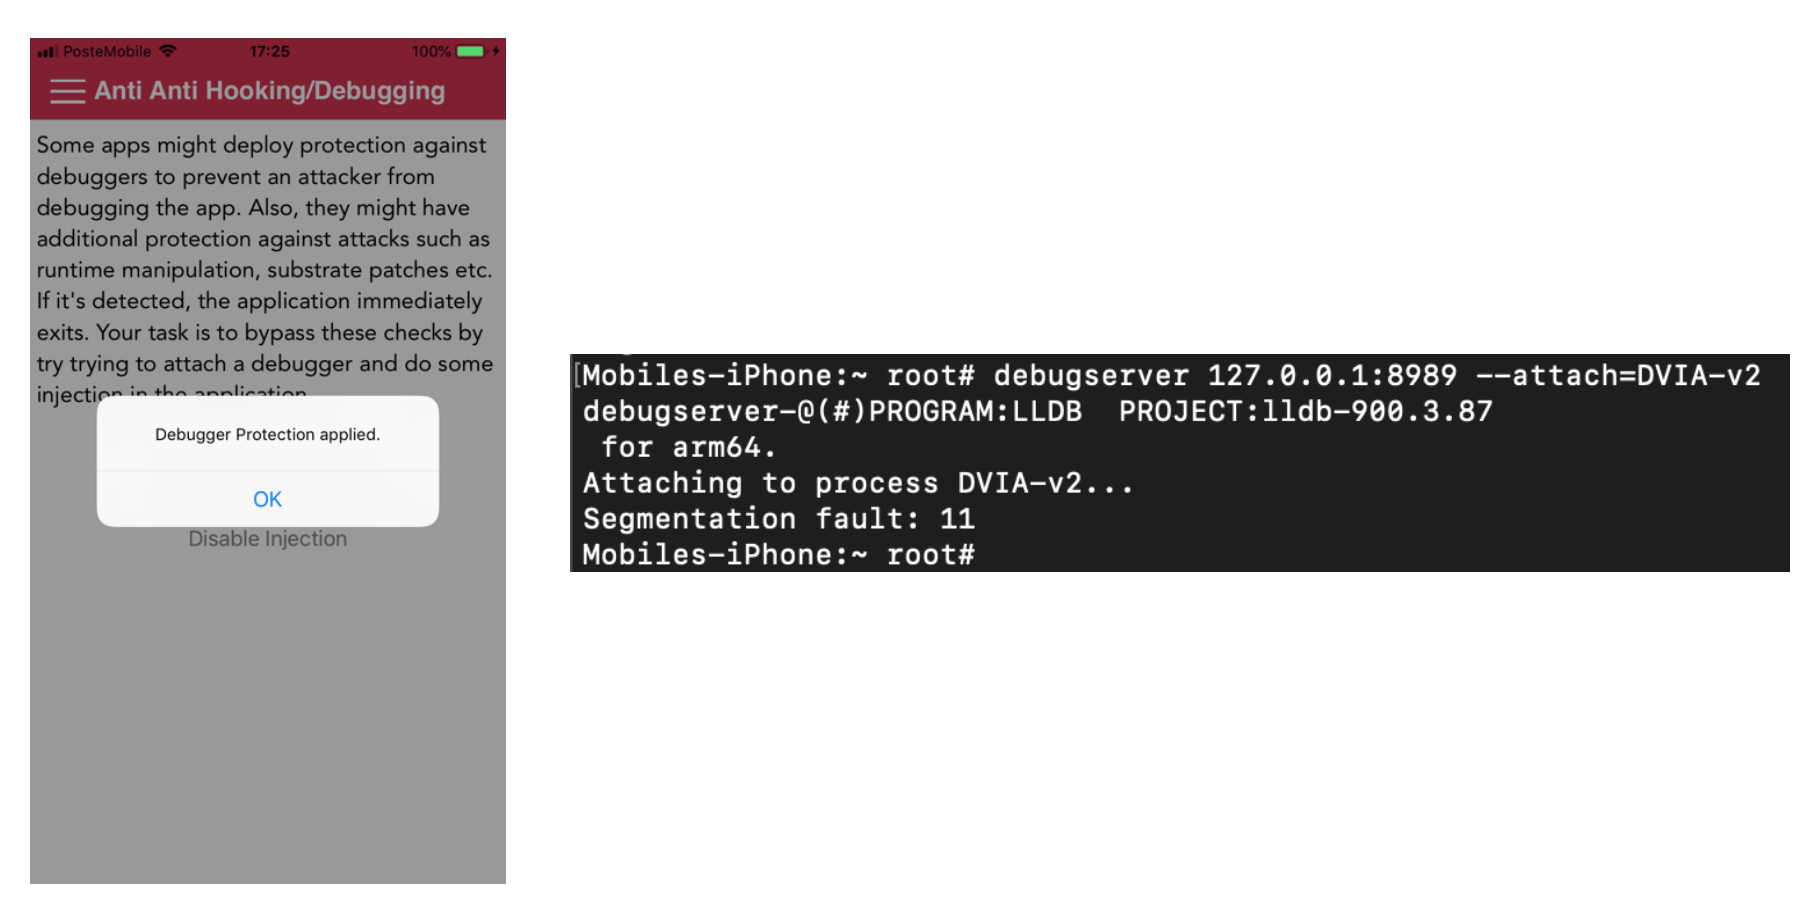
If the debugger is attached and the “Disable Debugging” is pressed, the application will exit with status 45.
We have to reverse and figure out what it’s happening. This first part describes what I did the first time I tried to bypass the anti-debugging.
To reverse the Mach-O file, I used Hopper, let’s try to find the anti-debugging checks.
Reverse isDebugged Function
Looking for the word “debug” we can find an interesting function called “isDebugged”.
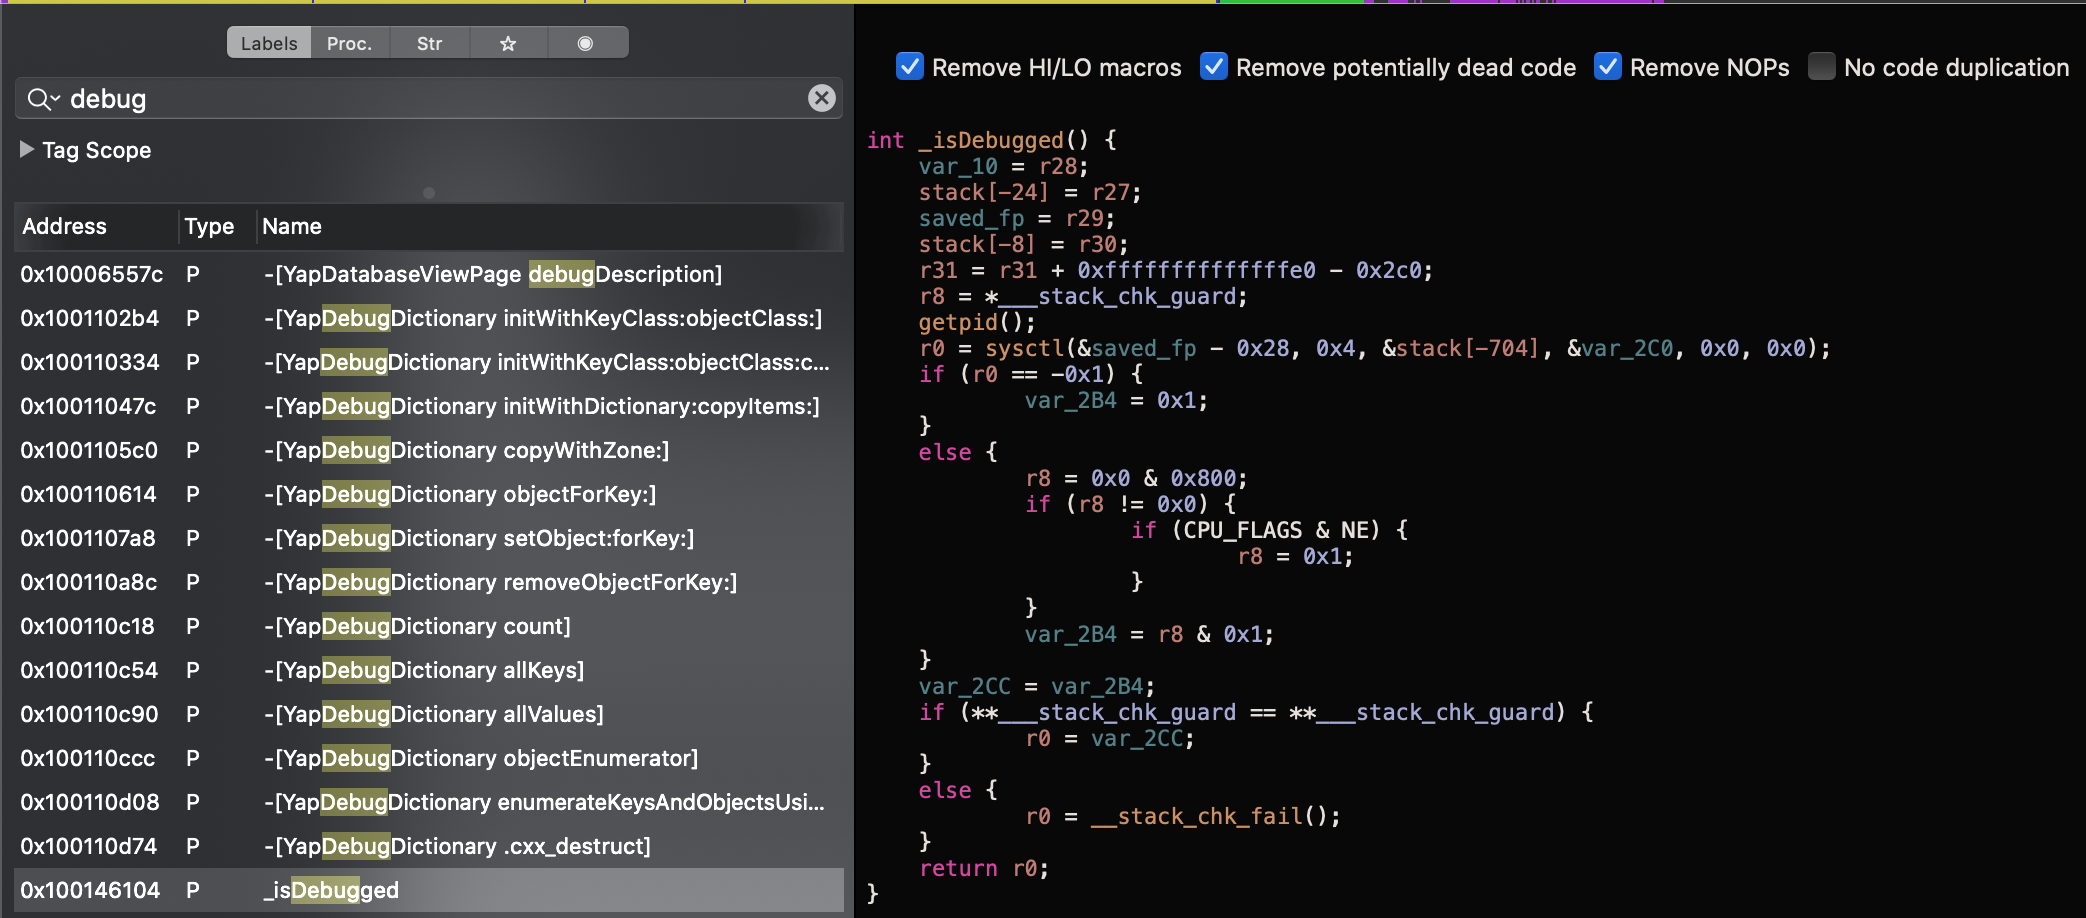
Because there is a getpid and a sysctl call, I’m sure this is what we are looking for, and google can help us with these two posts:
- https://alexomara.com/blog/defeating-anti-debugging-techniques-macos-amibeingdebugged
- https://kov4l3nko.github.io/blog/2016-03-07-bypassing-anti-debugging-musically-for-ios
How we can see, the r0 register will return the result of the check, so what we have to do, is to change the r0 register value before the return instruction.
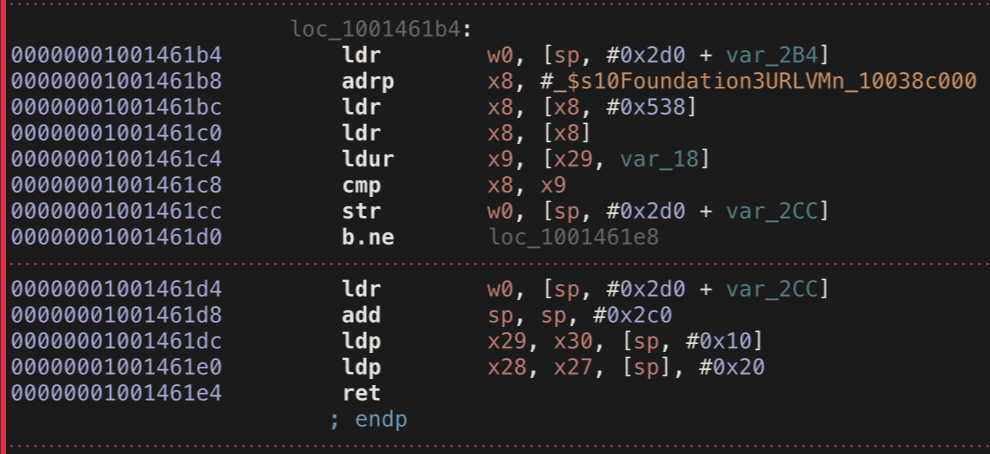
We have to to set a breakpoint on 0x00000001001461e4 and change the r0 register value to 0x0.
Reverse disable_gdb Function
Looking for the word “Disabledeb” (the button label “Disable Debugging”) we can find a method containing a call to function called “disable_gdb”.
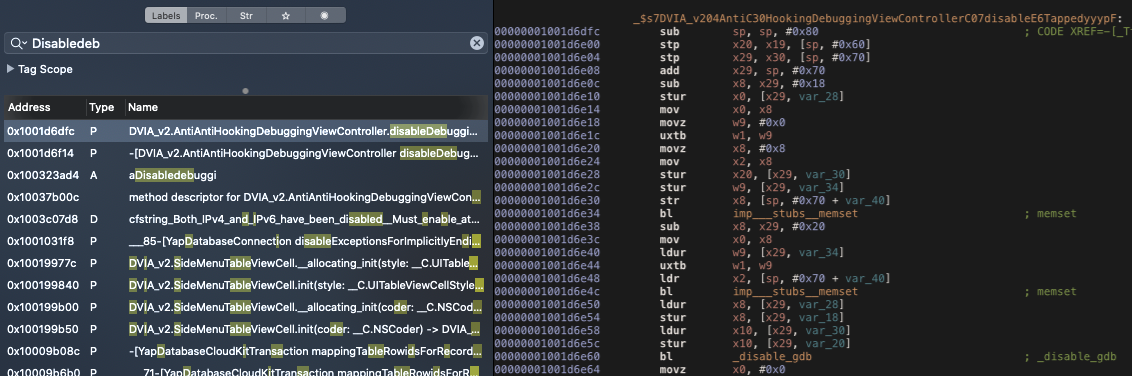
The following images shows the disable_gdb pseudo code and the arm code.
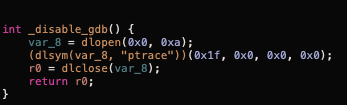
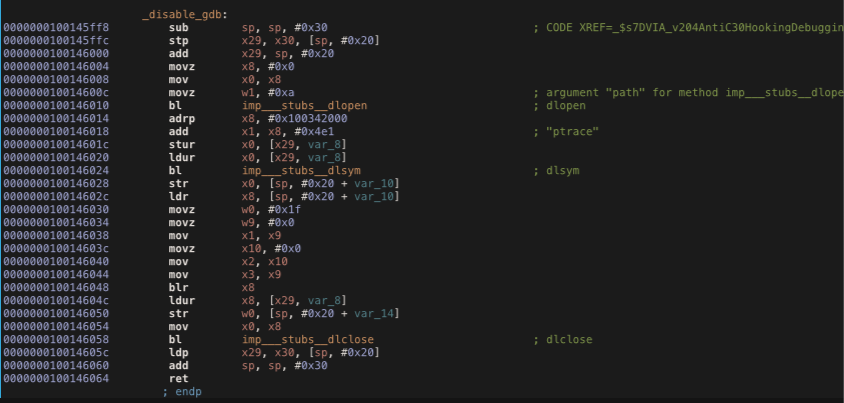
The ptrace syscall is used for preventing the debugging of a process using the PT_DENY_ATTACH request as described in the Apple manual.
We can change the x0 register value before the return instruction at 0x0000000100146064 or we can change the PT_DENY_ATTACH (0x1f) value in w0 with 0x0 at 0x0000000100146034.
Bypassing the Checks in LLDB
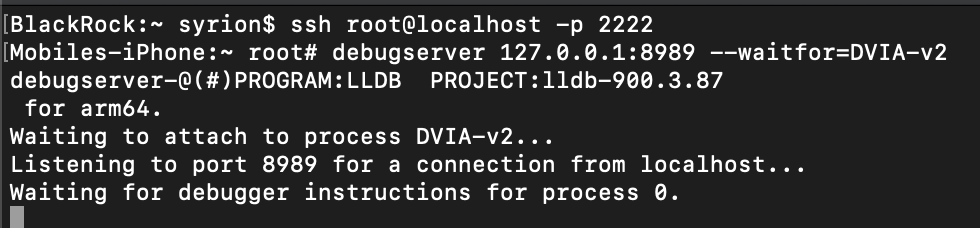
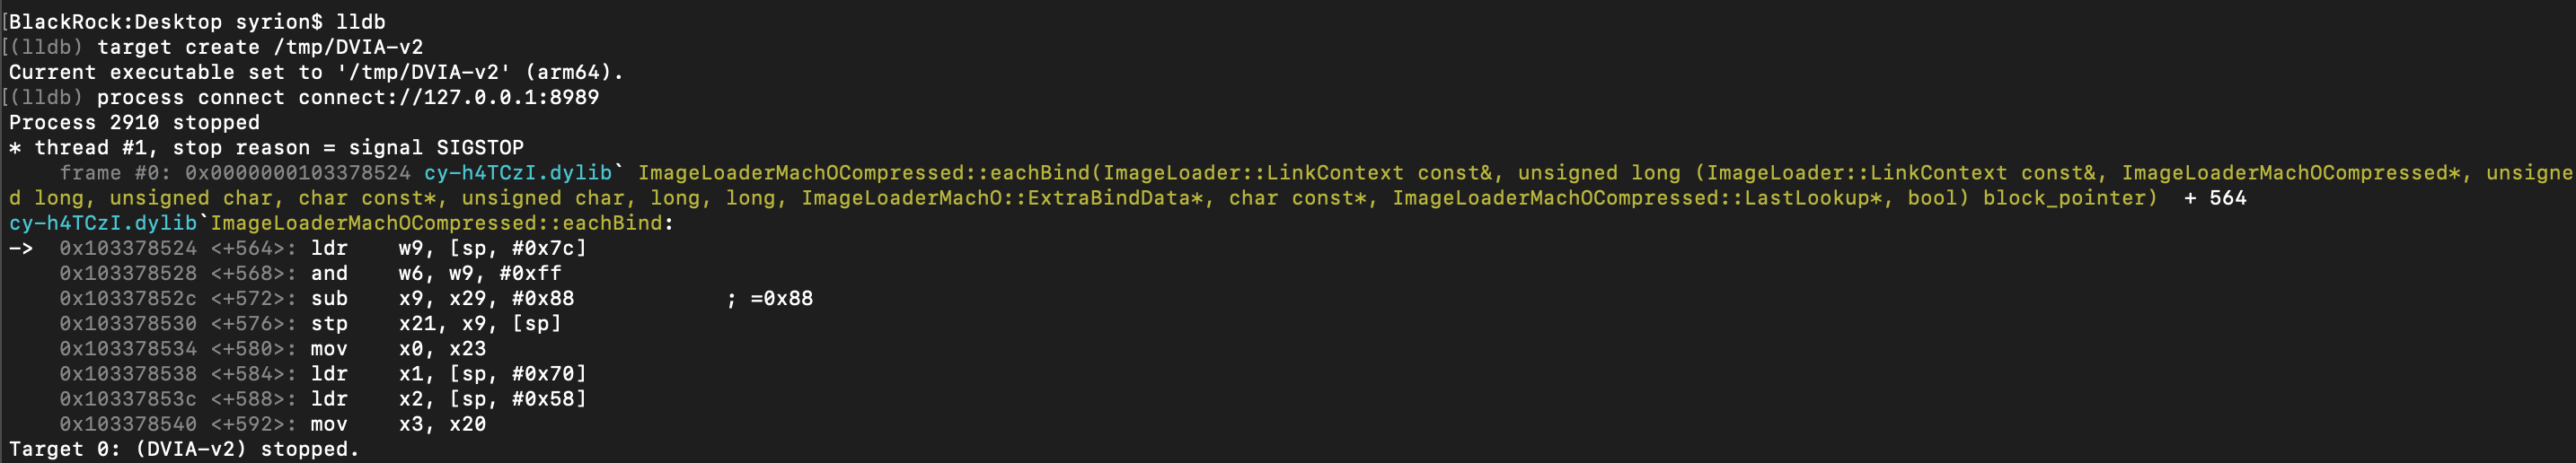
Let’s run debugserver and lldb before our application starts.
Using the image section dump, we can calculate the ASLR shift.
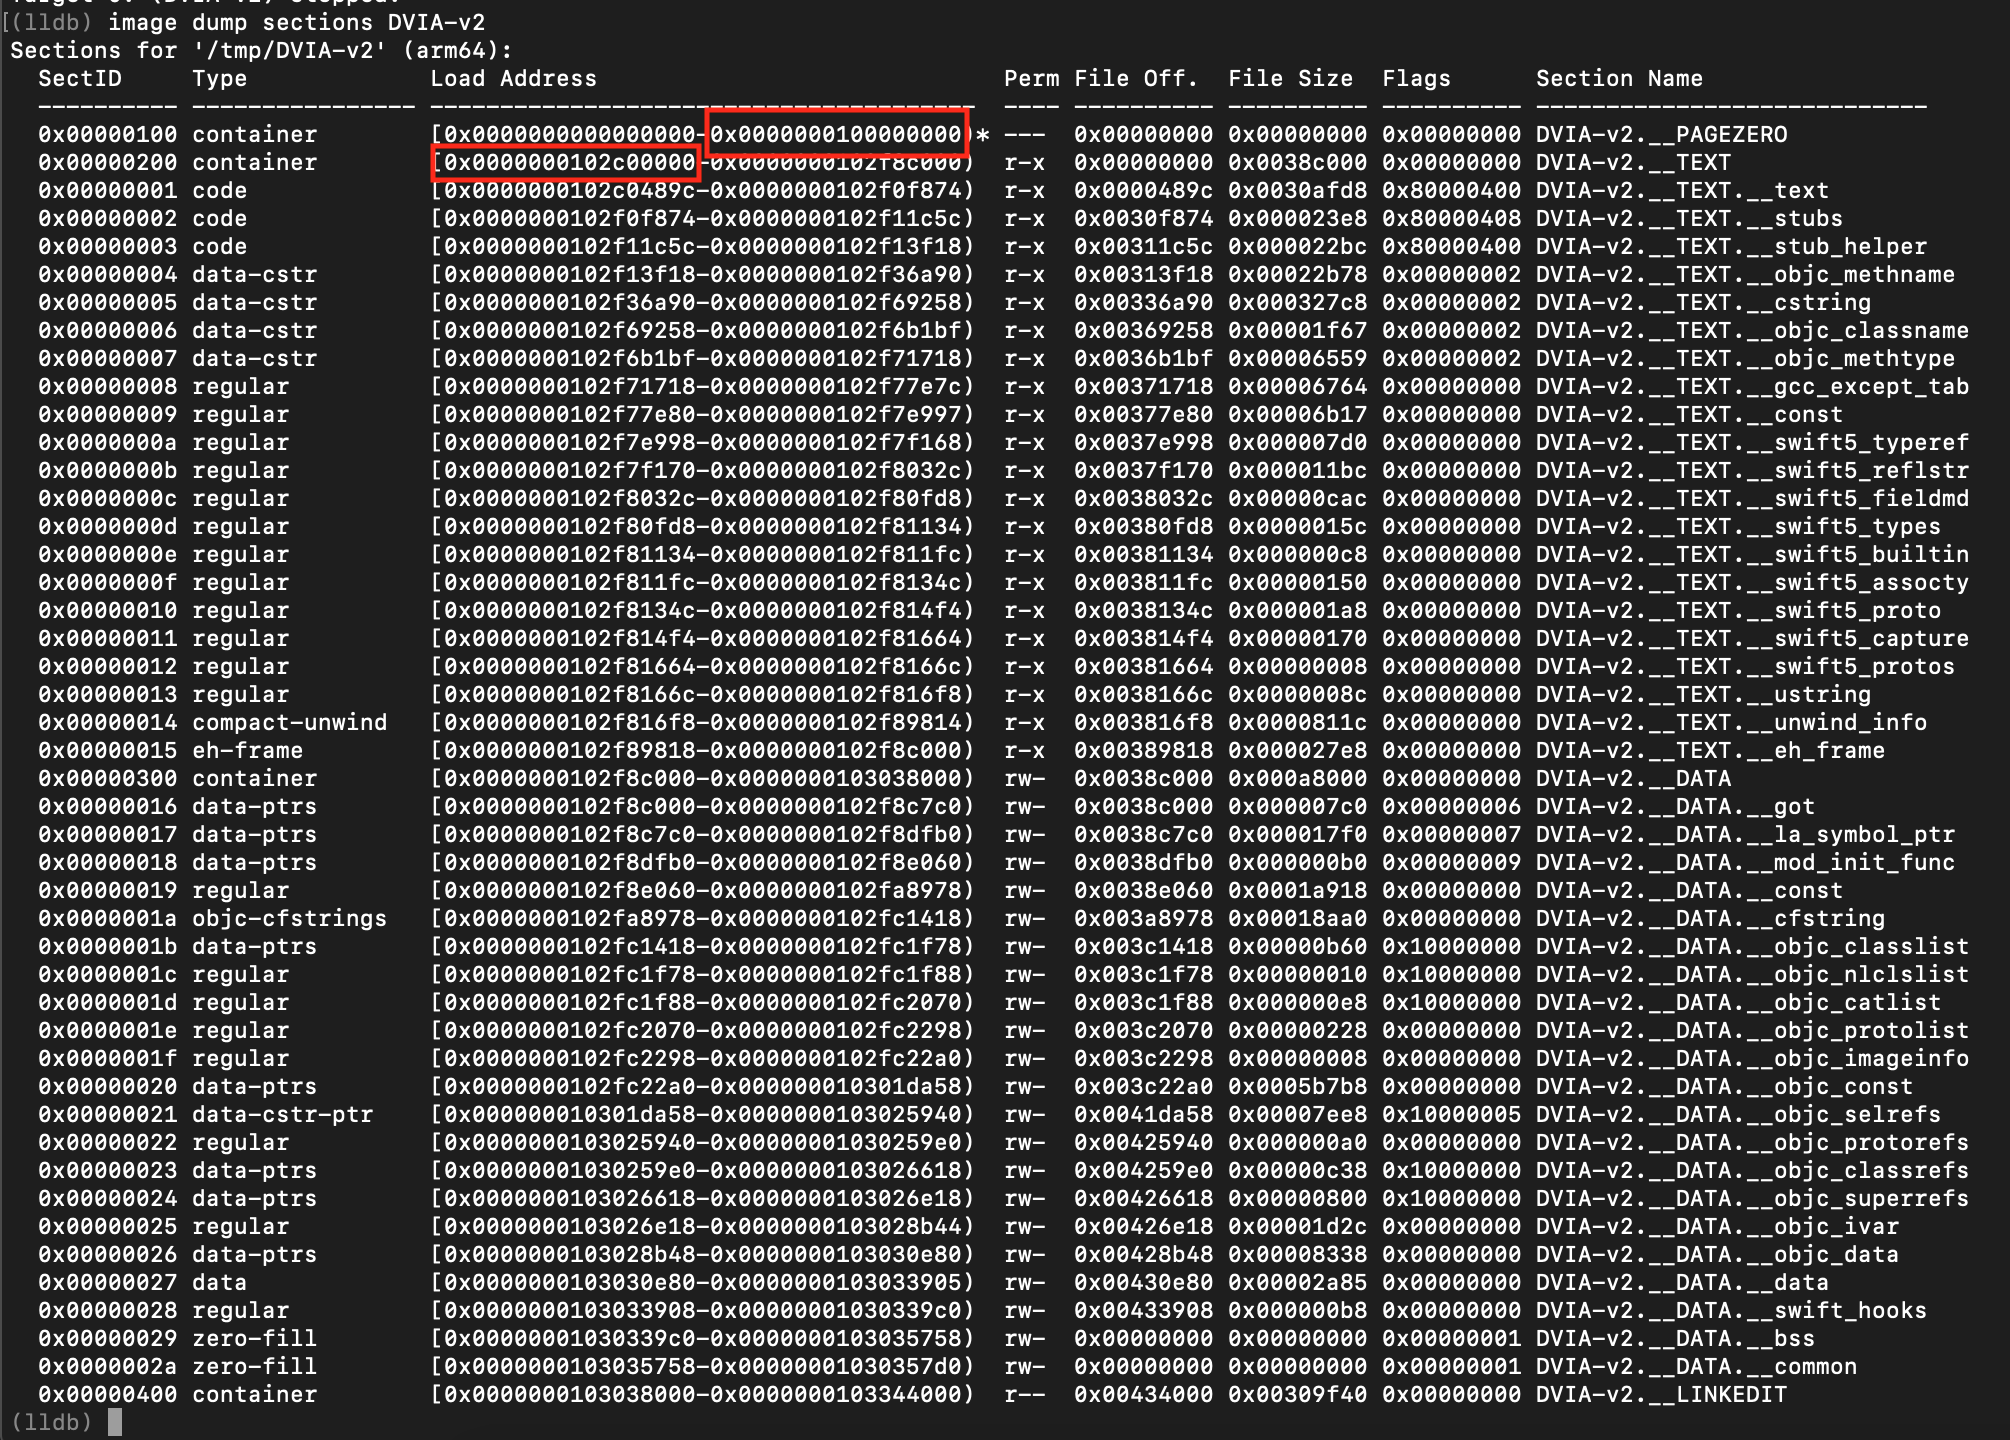
ASRL Shift = 0x0000000102c00000 - 0x0000000100000000 = 0x2c00000
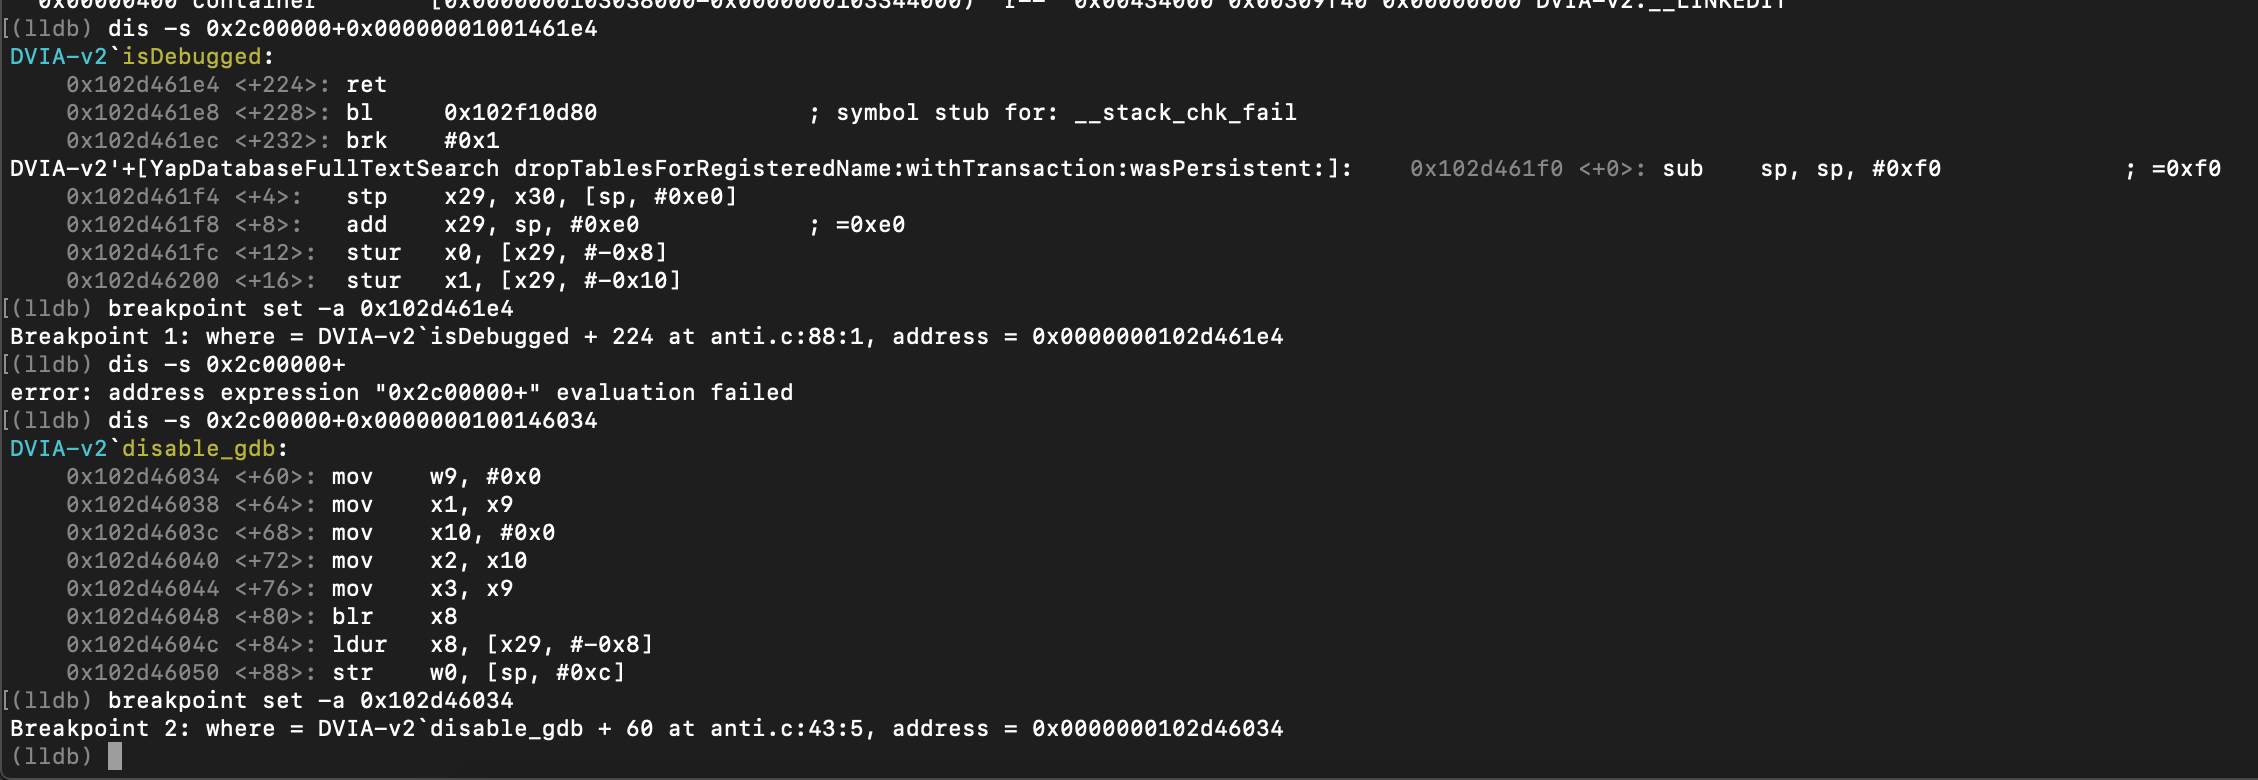
At this point we can set our breakpoints, by disassembly it we can be sure the addresses are right.
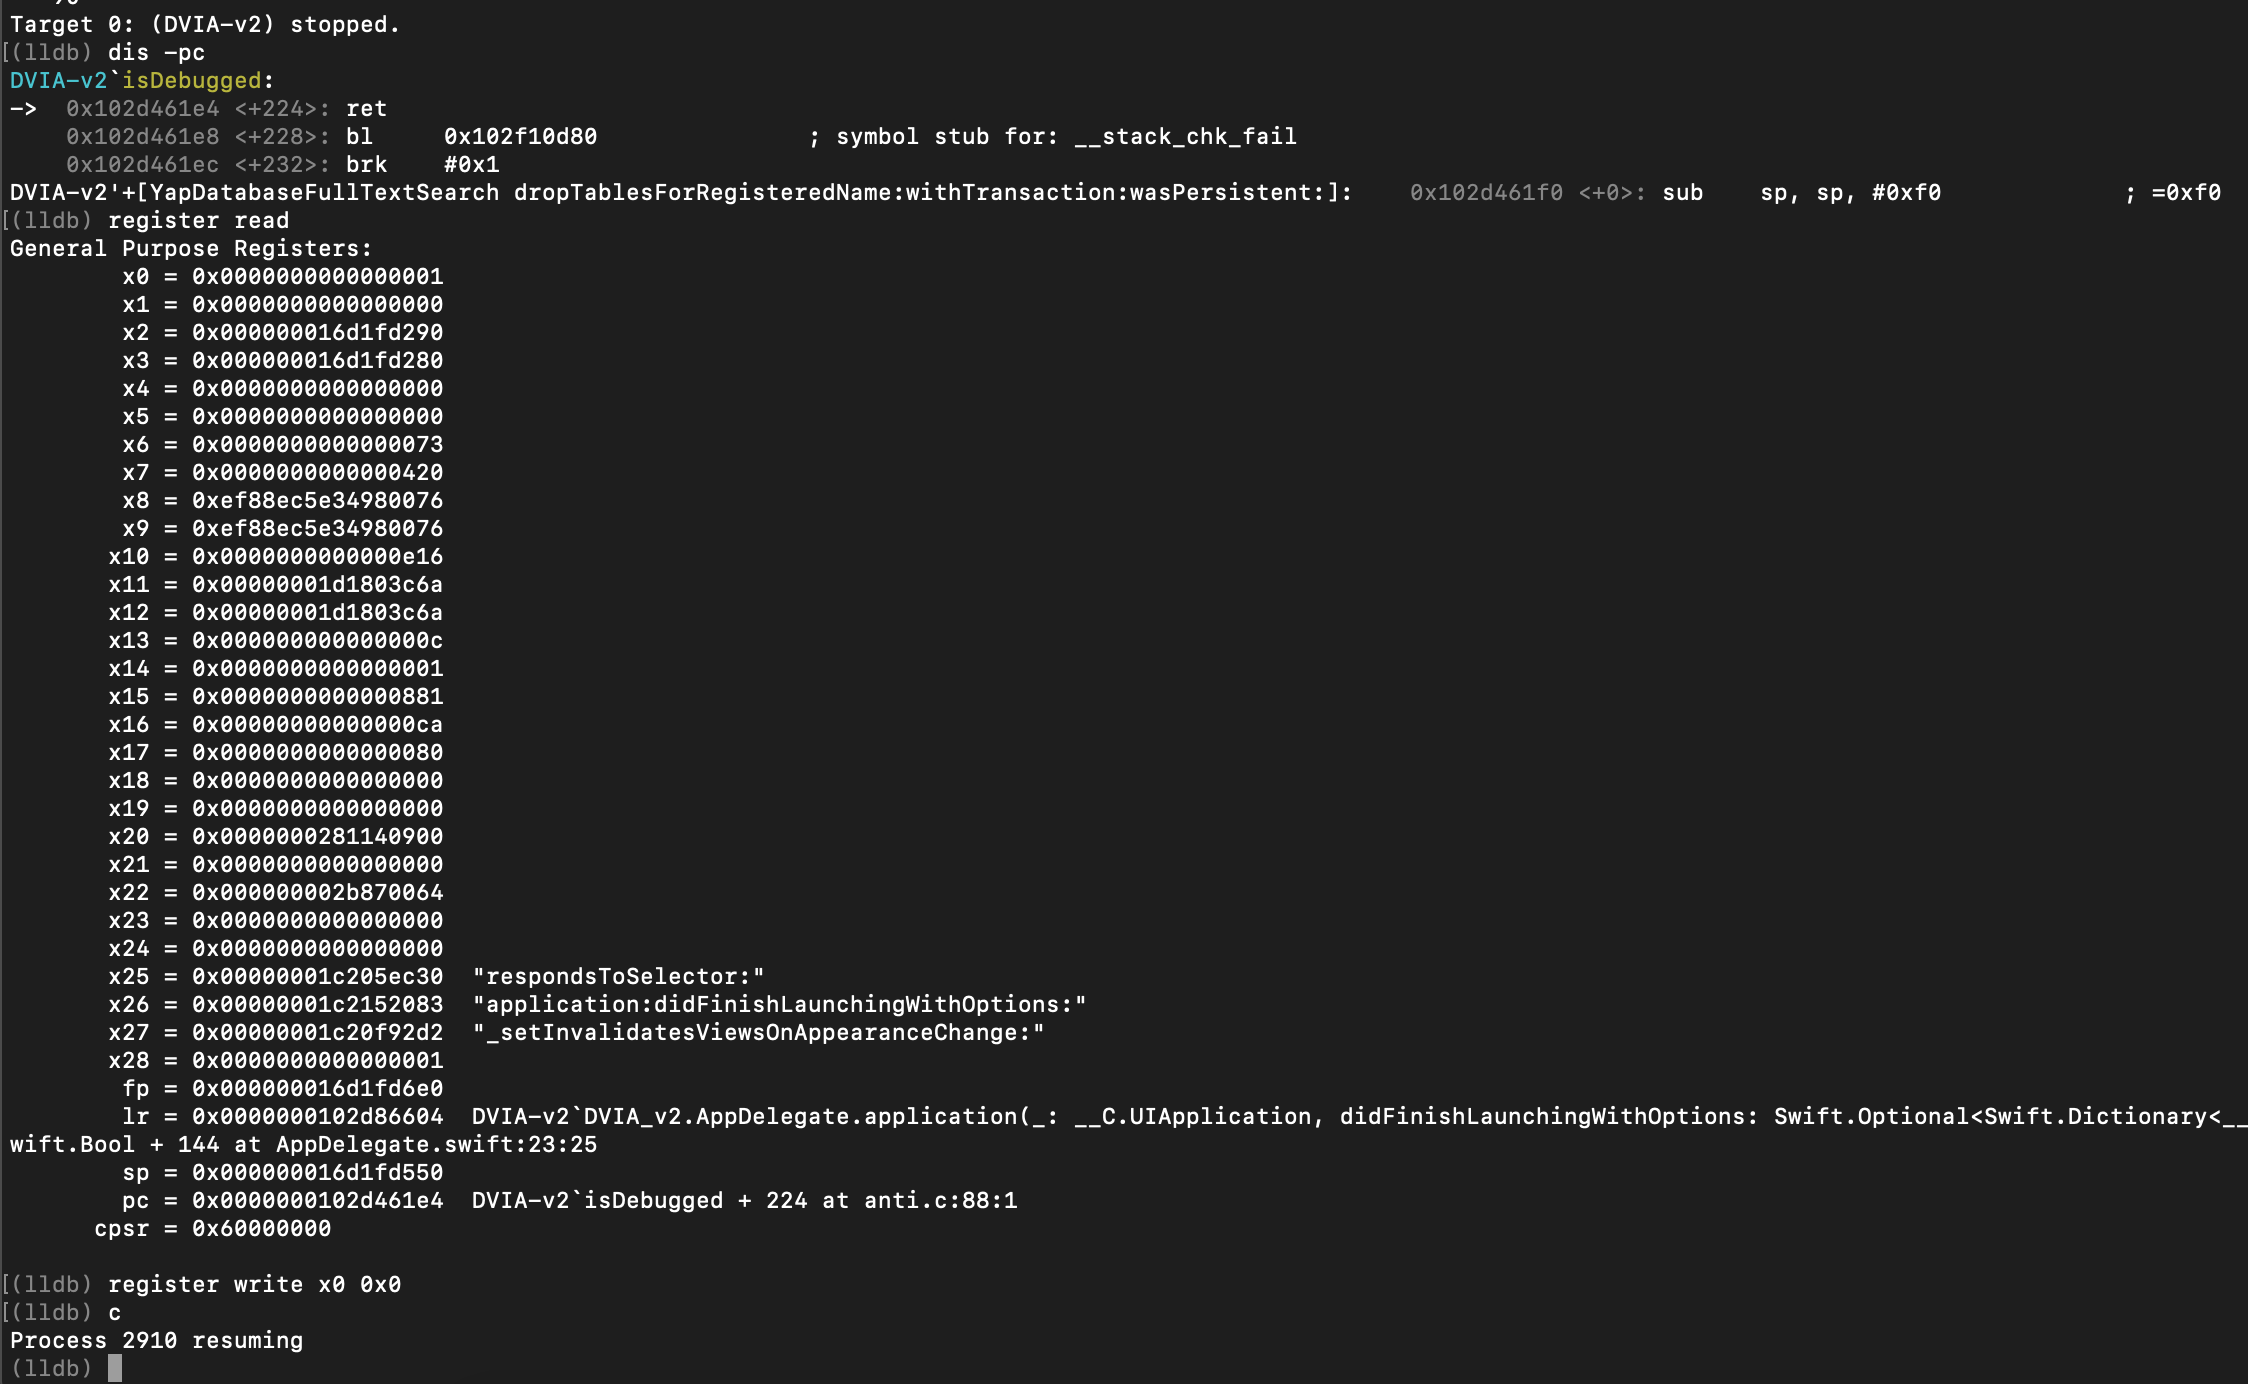
By continuing, the breakpoint 1 (function isDebugged) is reached and by changing the x0 register value to 0x0 we can bypass the check.
How we can see, the application didn’t stop. By pressing “Disable Debugging” the breakpoint 2 (function disable_gdb) is reached. How we can see the PT_DENY_ATTACH value 0xf1 is in the x0 register. We can change it to 0x0 and continue the process.
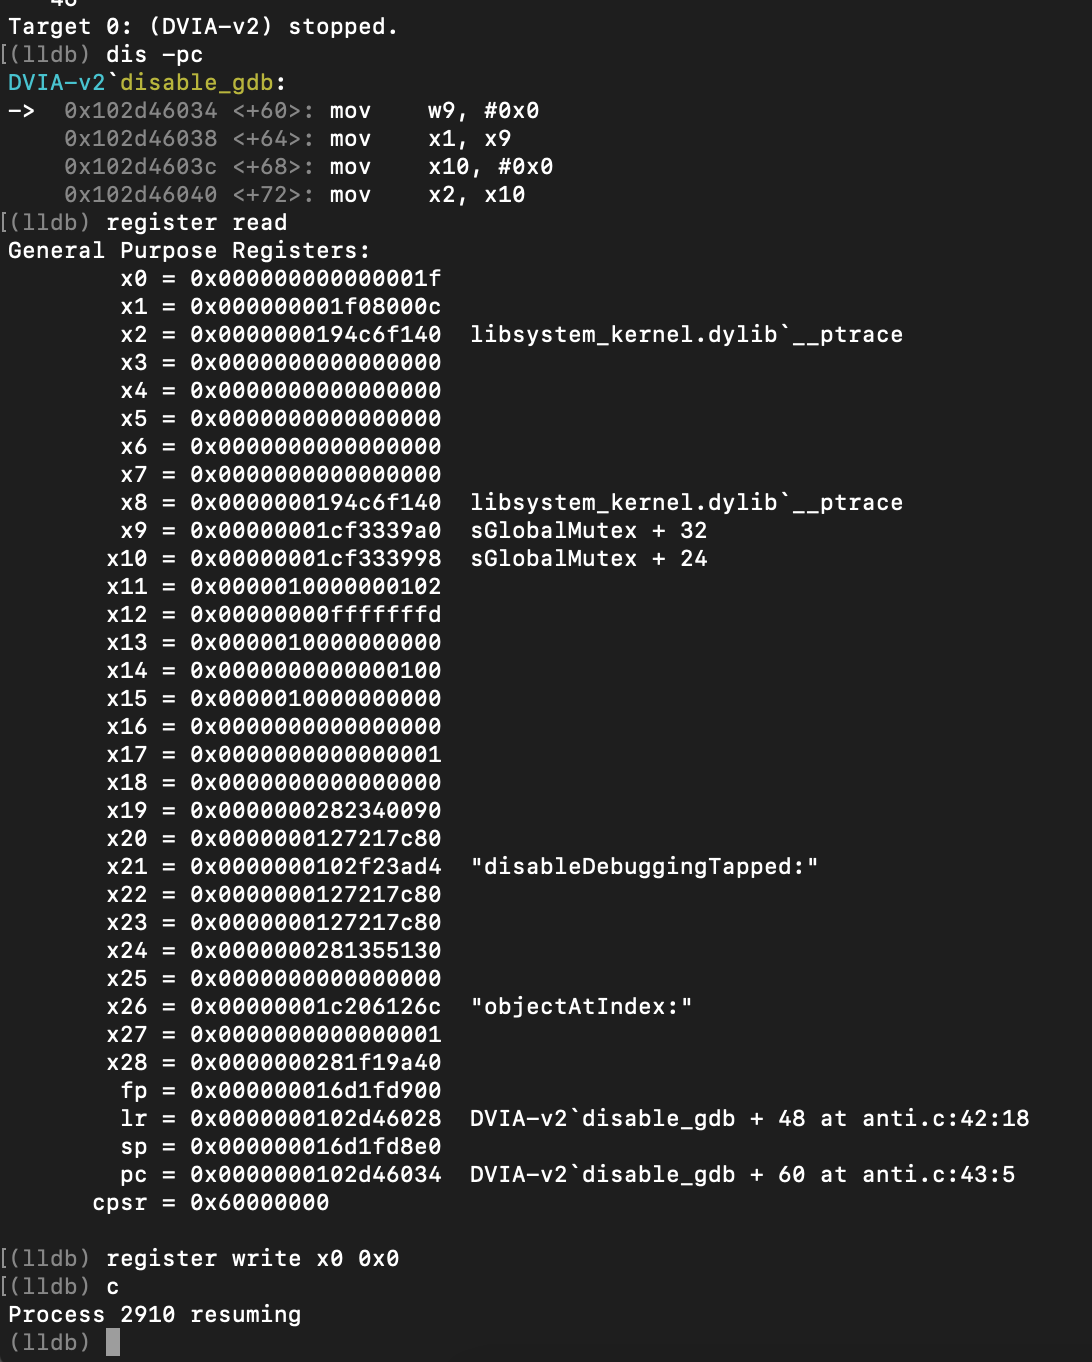
The application doesn’t exit, we successfully bypass the two checks.